Understanding the world’s largest exporter and its direct impact on the products you buy
Last Updated: February 2025 | Author: OriginalPricing Research Team |
Key Takeaways
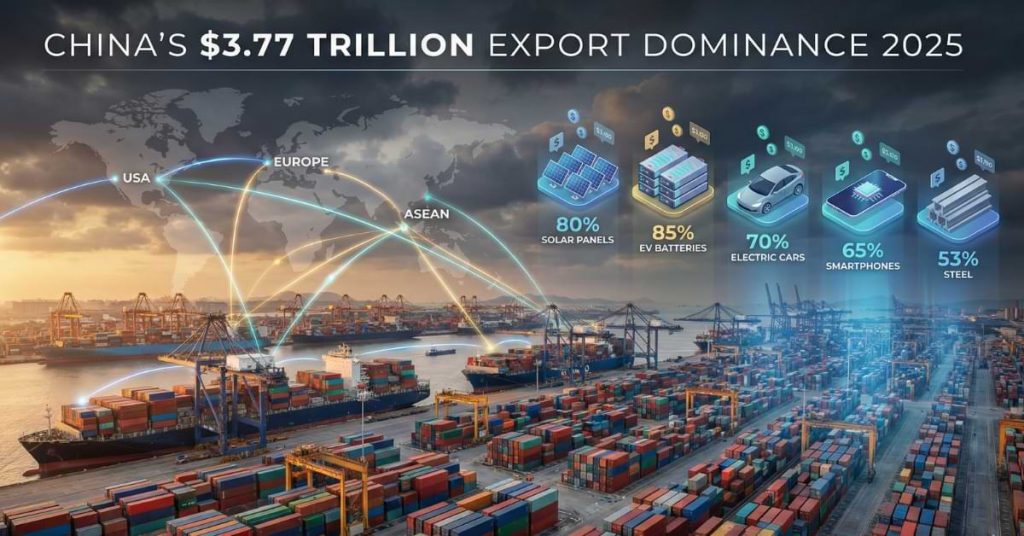
- China exported a record $3.77 trillion in goods in 2025, representing approximately 15% of all global exports
- The trade surplus surpassed $1 trillion for the first time in history, reaching $1.19 trillion
- Exports to the United States declined 20% due to tariffs, but ASEAN and emerging markets absorbed the shift
- China dominates critical sectors: 80%+ of solar manufacturing, 65% of EV batteries, and 70% of global EV production
The Scale of China’s Export Economy in 2025
China shattered export records in 2025, shipping $3.77 trillion worth of goods worldwide, the largest annual export haul by any nation in history. According to official data from China’s General Administration of Customs, this represents a 5.5% increase over 2024’s already impressive $3.58 trillion and cements China’s position as the world’s undisputed manufacturing powerhouse.
More remarkable is the trade surplus. As reported by CNBC, China’s 2025 surplus reached $1.19 trillion, crossing the trillion-dollar threshold for the first time ever. To put this in perspective, this single-year surplus exceeds the entire GDP of Saudi Arabia and triples any pre-2022 record set by any country.
For consumers researching accurate pricing information, understanding China’s role in global manufacturing is essential. Whether you’re buying a smartphone, solar panels, or an electric vehicle, Chinese production costs serve as a baseline that influences retail prices worldwide.
Top Export Categories: What China Sells to the World
Electrical Machinery and Equipment: $928 Billion
The crown jewel of Chinese exports, electrical machinery and equipment, accounted for over $928 billion in 2024-2025, representing more than a quarter of total exports. According to World’s Top Exports, this category includes smartphones, LED displays, circuit boards, semiconductors, and consumer electronics.
When consumers research electronics pricing for items like televisions, laptops, or smart home devices, they’re typically looking at products manufactured in Chinese facilities. Understanding this supply chain helps explain pricing variations across different brands.
Machinery and Computers: $568 Billion
The second-largest category at $568.3 billion encompasses desktop and laptop computers, industrial equipment, automation systems, and data processing equipment. China Briefing reports this sector saw 11% year-over-year growth, driven by global digitization trends and AI infrastructure demand.
Vehicles and Transportation: $216 Billion
Chinese vehicle exports reached $216.1 billion in 2024, up 12.1% year-over-year. According to the International Energy Agency’s Global EV Outlook 2025, China exported approximately 6.5 million vehicles, surpassing Japan to become the world’s largest automobile exporter. Electric vehicles led this transformation, with Chinese brands now representing serious competition in global markets.
For consumers researching vehicle pricing, Chinese EVs often offer comparable technology at significantly lower price points than Western manufacturers.
Additional Major Categories
| Category | Export Value | Share of Total |
|---|---|---|
| Plastics and plastic articles | $141.3 billion | 4.0% |
| Furniture, bedding, and lighting | $126.4 billion | 3.5% |
| Iron and steel articles | $100.1 billion | 2.8% |
| Knit clothing and accessories | $85.4 billion | 2.4% |
| Organic chemicals | $82.6 billion | 2.3% |
| Toys and games | $82.5 billion | 2.3% |
| Optical and medical apparatus | $72.5 billion | 2.0% |
Source: World’s Top Exports China Analysis
Where Chinese Exports Go: Major Destinations?
ASEAN Becomes the Largest Trading Partner
A significant shift occurred in 2024-2025: ASEAN surpassed the United States as China’s largest export destination bloc at $586.5 billion. According to Xinhua News Agency, this represents the fifth consecutive year of ASEAN holding the top position and reflects China’s strategic diversification away from Western markets.
| Rank | Destination | 2024 Exports | Year-over-Year Change |
|---|---|---|---|
| 1 | United States | $524.9 billion | +4.6% (2024), -20% (2025) |
| 2 | Hong Kong | $291.4 billion | +5.4% |
| 3 | Vietnam | $161.8 billion | +17.1% |
| 4 | Japan | $152.0 billion | -3.6% |
| 5 | South Korea | $146.4 billion | -1.9% |
| 6 | India | $120.5 billion | +2.3% |
| 7 | Russia | $115.5 billion | +4.0% |
| 8 | Germany | $107.0 billion | +6.3% |
| 9 | Malaysia | $101.2 billion | +14.9% |
| 10 | Netherlands | $91.1 billion | -9.1% |
Source: World’s Top Exports – China’s Trading Partners
The US-China Trade Transformation
The 2025 picture shifted dramatically due to tariffs. CNN Business reports that exports to the United States fell approximately 20% for the full year, plunging 30% in December alone. However, China compensated through aggressive diversification: exports to Africa jumped 26%, to ASEAN 13%, and to the European Union 8%.
The Council on Foreign Relations notes that the US share of China’s total exports dropped from 19% in 2017 to approximately 11% in 2025, a structural reorientation that appears durable regardless of future tariff policies.
For Americans researching fair market prices, this shift means product availability and pricing dynamics are changing as supply chains reorganize around tariff barriers.
China’s Global Market Dominance by Sector
Certain product categories show remarkable Chinese market concentration that directly impacts global pricing and availability.
Solar Panels: 80%+ Global Manufacturing Capacity
According to Wood Mackenzie, China controls over 80% of global solar manufacturing capacity across the entire value chain, polysilicon, wafers (over 95%), cells, and modules. Chinese firms supplied 72% of global solar module exports in 2024. A Chinese-made panel costs approximately 50% less than a European equivalent and 65% less than an American one.
Lithium-Ion Batteries: 85% Manufacturing Capacity
China holds approximately 85% of global battery cell manufacturing capacity. According to CnEVPost, Chinese companies, led by CATL at 37.9% market share and BYD at 17.2%, control roughly 65-69% of global EV battery installations. China also dominates upstream: over 90% of cathode materials and 97% of anode materials are processed there.
This concentration affects pricing for electric vehicles, laptops, tablets, power tools, and energy storage systems.
Electric Vehicles: 70% of Global Production
The International Energy Agency reports China produced over 70% of global EVs in 2024, sold 12.87 million domestically (47.9% of all vehicle sales), and accounted for roughly 40% of global EV exports. Total vehicle production reached 31.28 million units, the world’s largest by far.
Additional Sectors of Dominance
| Sector | China’s Global Share | Source |
|---|---|---|
| Crude steel production | 53% | Visual Capitalist |
| Shipbuilding completions | 55% | Brookes Bell |
| New shipbuilding orders | 74% | Brookes Bell |
| Rare earth mining | 69% | China Briefing |
| Rare earth processing | 90% | IEA |
| Smartphone manufacturing | 65-70% | Industry estimates |
| Telecom equipment | 42% | ITIF |
How Tariffs Affect Consumer Prices?
The 2025 Tariff Escalation
The tariff landscape transformed dramatically in early 2025. According to the Peterson Institute for International Economics (PIIE), when the new administration took office on January 20, the average US tariff on Chinese goods stood at 20.7% (up from 3.1% pre-trade war in 2018). Subsequent escalations pushed rates significantly higher.
Current effective tariff rates on Chinese goods as of February 2025, per China Briefing’s tariff tracker:
| Product Category | Effective Tariff Rate |
|---|---|
| Electric vehicles | 110%+ |
| Solar panels and semiconductors | 60%+ |
| Steel and aluminum | 60%+ |
| EV batteries | 35%+ |
| General manufactured goods | 35%+ |
Direct Impact on Consumer Prices
These tariffs translate directly into higher consumer prices. A product with a $100 Chinese export price might retail for $200+ after tariffs, shipping, and retail margins. Understanding these cost layers helps consumers researching value pricing evaluate whether prices reflect genuine costs or artificial markups.
China’s Currency Advantage
The yuan traded at approximately 7.27-7.30 per dollar in early 2025, having depreciated about 3% nominally against the dollar in 2024. According to the Council on Foreign Relations, because China experienced producer price deflation while trading partners saw inflation, the yuan’s real effective exchange rate fell approximately 15-20% from its 2022 highs.
CNBC reports that this real depreciation has been a powerful driver of China’s export price advantage, often overwhelming tariffs and trade defense measures in many markets.
What does this mean for Smart Shoppers?
Understanding Price Floors
Chinese manufacturing costs establish the floor price for most consumer products. When researching transparent pricing, the lowest available prices typically reflect Chinese production costs plus distribution margins.
Evaluating Brand Premiums
Many Western brands manufacture in China but charge premiums for brand recognition, warranty support, or perceived quality. Understanding underlying production costs helps consumers determine whether brand premiums represent genuine value.
Timing Considerations
Currency fluctuations and tariff changes create opportunities for price-aware consumers. Products imported before tariff increases may be priced differently than identical products arriving after new duties take effect.
Supply Chain Awareness
As Chinese exports diversify away from the US, product availability patterns are shifting. Some items may become harder to find while alternatives from Vietnam, Mexico, or other countries become more common.
The Outlook: What Comes Next
Continued Diversification
According to Trading Economics, China’s trade routes are permanently reshaping. The US share of China’s total exports dropped from 19% in 2017 to approximately 11% in 2025, a structural reorientation that appears durable regardless of tariff policies.
Price Deflation in Key Sectors
Chinese manufacturers are cutting prices aggressively to maintain market share. ING Think notes that export prices for solar panels, batteries, and electronics continue falling, which should eventually benefit consumers even in markets with high tariffs.
Technology Advancement
China’s integrated circuit exports reached $181.7 billion in 2025, up 24.7% year-over-year, signaling growing semiconductor self-sufficiency. This could affect pricing for electronics as supply chains evolve.